Pareto
Advertisement
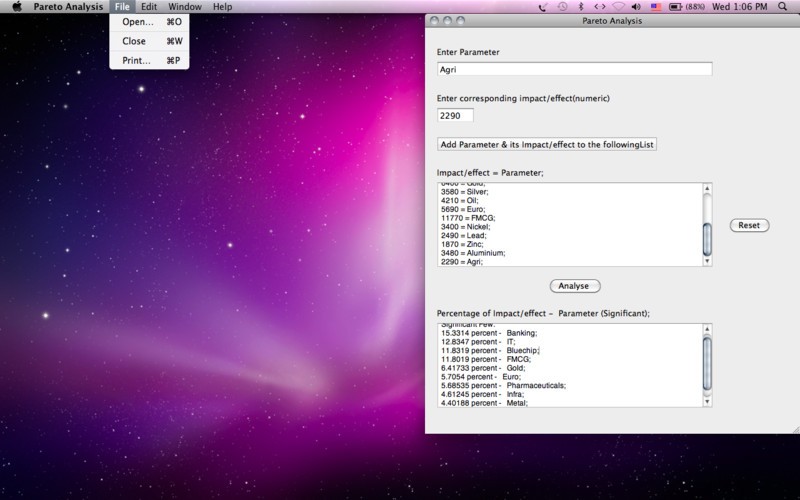
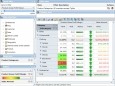
Pareto Analysis v.1.0
Pareto Analysis is a statistical technique in decision making that is used for selection of a limited number of tasks that produce significant overall effect.
Advertisement
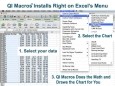
QI Macros SPC Software for Excel v.2016-08
Affordable, easy to use SPC add-in for Excel draws pareto charts, control charts, histograms, box and whisker plots, scatter plots and more. Just select your data and then select a chart from QI Macros menu. Automated fishbone, statistical tests too.
RJMetrics 80/20 Analyzer v.1.0.0
The 80/20 rule, also known as the Pareto principle, is widely used in a variety of financial settings.

Aspose.Chart for .NET
Aspose.Chart is a .NET charting component that can create more than 20 chart types like: area, bar, doughnut, line, pie, point, step, bubble, candlestick, cube, curve, CurveArea, gantt, scatter, contour, HighLowClose, OpenHighLowClose and pareto chart

SEO Mindset Explored Software
Here is what you will discover in SEO Mindset: * How to customize your SEO strategy for maximum effectiveness. Despite what some people say, every site must take a custom approach and I tell you exactly how to do it. (Page 10) * Use the 80-20 Rule (Pareto
The QI Macros for Excel v.11.0
The QI Macros SPC Software for Excel draws pareto charts, control charts, histograms, box and whisker plots, scatter plots and more. Also includes over 80 fill in the blank templates including QFD, GageR&R, DOE, PPAP and FMEA.
QI Macros v.7 2
The QI Macros SPC Software for Excel draws pareto charts, control charts, histograms, box and whisker plots, scatter plots and more. There are four 'wizards' that figure out what chart or statistic to draw based on your data.
SPC XL v.2.40.211.0
This add-in adds powerful yet easy-to-use statistical analysis features.

80Twenty v.1.0.0.0
This is a charting tool for pareto-like analysis, giving a column chart of randomly input data pairs which is sorted lo-hi. This might be particularly useful for Economists, Quality Control, Business and Government people.
EasyFit
Allows to easily and quickly select the probability distribution which best fits to data, reducing your analysis times and helping you make better decisions. Provides an integrated environment including data management, analysis, and reporting
RadarCube ASP.NET Direct v.3.01.0
Fastest and prowerful library (OLAP Grid and OLAP Chart controls) for ASP.NET and Silverlight. Supports IE, Firefox (also in Linux and MAC OS), Opera, Chrome. Connects to any database and requires minimum server memory. Medium trust compliant.